What Is an EL Test and How Is It Done on a Solar Panel?
Quality Controleyerod · · 9 min read
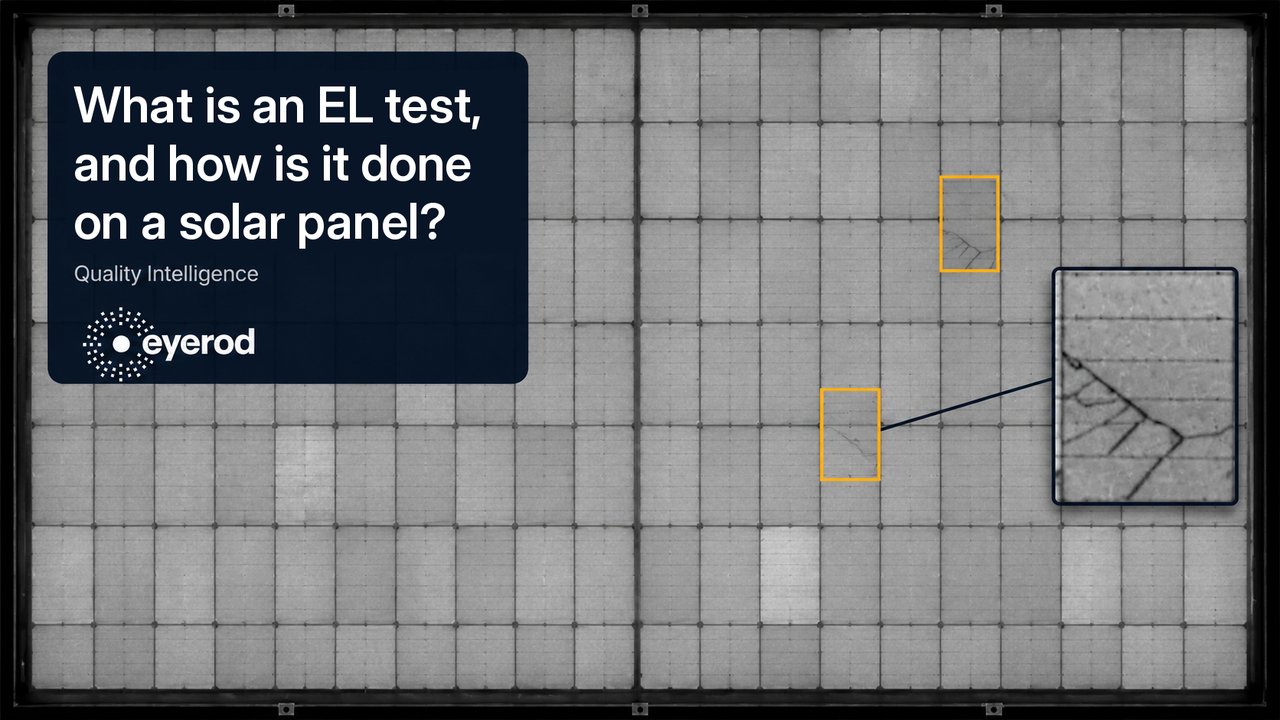
An EL test images the near-infrared light that solar cells emit when a controlled electric current is applied to the panel, using a special camera. Also known as electroluminescence testing, the method is used to examine microcracks, cell regions that have been electrically disconnected, and some interconnection defects.
Even when a panel’s glass looks intact, the silicon cells underneath can be damaged. A solar panel EL test helps make these cell-level problems visible where a visual check cannot. But a crack in the image does not, on its own, show that the panel has lost a given share of its power.
This is where EL inspection becomes valuable for solar investors, EPC contractors and operations teams: it shows which modules need a closer look and backs quality decisions with findings that can be put on record.
How does electroluminescence testing work?
In normal operation, a solar cell converts light into electricity. In EL inspection, an external DC source feeds current into the cell instead. Under this forward bias, electrons and holes recombine and part of the energy is released as light.
The light emitted by crystalline silicon cells lies in the near-infrared range and is invisible to the human eye. A camera with a suitable sensor records this faint emission and builds a grayscale image of the cells. The brightness distribution in the image carries information about the electrical connections, the cell material and the measurement conditions.
That is why an EL camera and a thermal camera do not do the same job. An EL image looks at the light produced by electrical excitation; a thermal image looks at the temperature distribution.
How is a solar panel EL test done?
The work has three main stages: preparation, imaging and evaluation. Whether the test runs in the factory or at an installed plant changes the equipment and the work plan.
1. The module and measurement conditions are prepared
First, the serial number and model of the panel and the purpose of the test are recorded. A pre-shipment check, a post-delivery damage inspection or the investigation of a fault in operation can call for different sampling plans.
A qualified team connects the module or string to the test setup, following proper electrical isolation and safety procedures. The current level is set according to the panel’s specifications and the measurement procedure; there is no single current value that applies to every panel.
2. The EL image is captured
While the panel is energized in a controlled way, a camera sensitive to near-infrared light records the image. Factories use darkened booths; in the field, the test is usually run at night or with setups that block the light. The reason is that ambient light can drown out the weak EL signal.
The camera’s focus, shooting angle, resolution and exposure settings affect the result. Suitable silicon CCD/CMOS sensors or InGaAs cameras can be used; the choice depends on the image quality and speed the application requires.
3. The images are analyzed and reported
Once image quality has been checked, the cells and suspicious areas are evaluated. Findings are matched to the serial number, and the defect’s location, appearance and any further tests needed go into the report.
If images are to be compared, the current, temperature and camera settings also have to be known. Looking only at the brightness of two images taken under different conditions is not enough to say that damage has progressed.
Which defects can an EL test show?
Electroluminescence imaging is especially useful for examining problems that affect electrical continuity within the cell. That said, similar image patterns can have different causes.
| Finding | Possible appearance in the EL image | What to watch for in the evaluation |
|---|---|---|
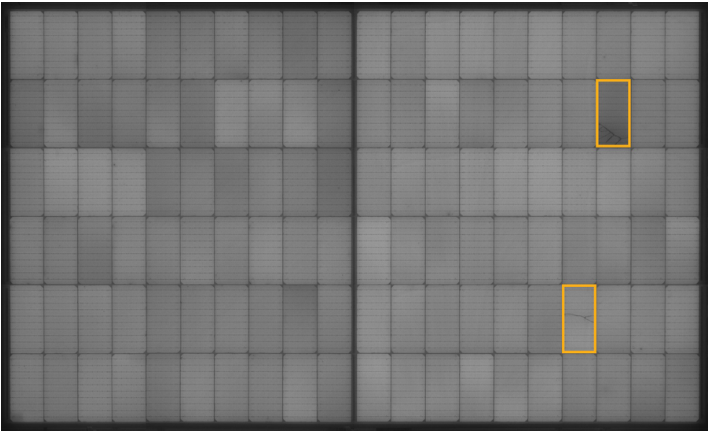
| Microcrack | Thin, dark or branching lines | Whether the crack electrically isolates part of the cell |
| Inactive cell area | Dark area with clear boundaries | The area’s location, connections and the module architecture |
| Broken cell | Multiple cracks and fragmented darkening | The extent of the damage and its electrical effect |
| Conductive path or interconnection defect | Stripe-shaped darkening, local brightness differences | Current collection paths and connection resistance |
| Suspected shunt or PID | Point-like darkening, concentrated at the edges or spread wider | The pattern alone is not a definitive diagnosis |
How these findings feed into purchasing and acceptance decisions is covered in EL image analysis in PV module quality control and acceptance criteria.
What do dark areas in an EL image mean?
A dark area means less EL signal is reaching the camera from that region. The cause may be a cell fragment separated by a crack, but it may also be high connection resistance, a leakage current path or a material difference.
Imaging conditions matter too. Focus errors, dirt on the surface, optical effects or unsuitable exposure can create darker patches that can be mistaken for defects. The natural grain boundaries of multicrystalline cells should not be read as mechanical cracks either.
For a reliable reading, the usability of the image is checked first; then the pattern is examined against the cell structure. In unclear cases, re-imaging at different current levels or a complementary electrical measurement may be needed. Likewise, a bright cell does not on its own mean the panel has passed every quality and safety check.
Does a microcrack always cause power loss?
Not every microcrack has the same effect. If the electrical connection between the two sides of the cell is preserved, the initial performance impact may be limited. When a crack cuts part of the cell off from the current collection paths, the risk of loss rises.
In the evaluation, a crack’s direction, location, the inactive area it creates and the panel’s interconnection architecture matter as much as the number of cracks. Half-cell and multi-busbar modules should not be treated the same as older cell designs. Mechanical loads and temperature cycling can also change how existing damage behaves over time.
For example, two panels may show cracks of similar length. In one, the electrical connection holds; in the other, a cell corner may have been cut off from the circuit. Looking only at crack length misses this difference.
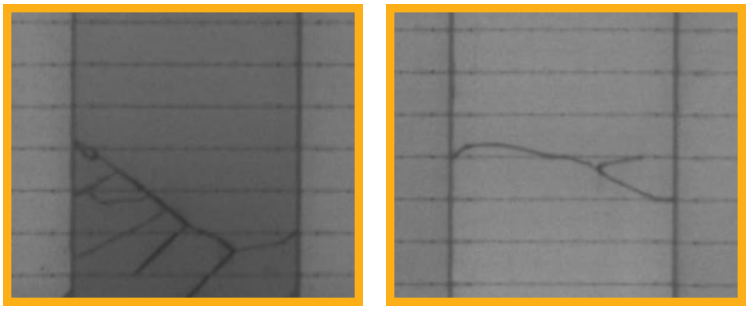
So watt loss or annual production loss cannot be calculated directly from an EL image. Assessing the power impact requires electrical measurements such as an I-V curve or, under suitable conditions, a flash test. The EL report provides the cell-level evidence that guides these measurements. We go into this in Does an EL image measure a panel’s annual power loss?
What is the difference between an EL test and a thermal camera?
Which method to use depends on the question to be answered. Examining cracks and interconnection structure inside the cell and finding temperature anomalies in an operating plant are different measurement needs.
| Comparison | EL test | Thermal inspection |
|---|---|---|
| Signal examined | Near-infrared emission produced by electrical excitation | Thermal radiation from the surface and temperature distribution |
| Main use | Cell cracks, inactive areas and interconnection anomalies | Hotspots and thermal anomalies in operation |
| Test conditions | Controlled electrical excitation; usually low ambient light | Suitable irradiance, load and weather conditions |
| Field planning | Requires electrical access and detailed imaging | Suited to wide-area drone surveys |
The IEA PVPS report on EL and infrared imaging supports evaluating these methods together. A crack that does not cause heating may not stand out in a thermal inspection; an EL image does not explain every temperature problem in operation either.
In practice, modules flagged in a thermal survey can be examined in detail with EL and I-V measurements where needed. This approach moves from a wide-area site survey to module-level inspection.
When is EL testing used in solar projects?
EL inspection can be used at different checkpoints in a panel’s life cycle. The purpose is not the same at every stage:
- During manufacturing and before shipment: To examine cell and interconnection defects and create a baseline record.
- On delivery to site: To compare with earlier images and look for changes that may have occurred in transport.
- During installation and commissioning: To document module condition after installation.
- During operation: To evaluate selected modules in detail after unexpected performance problems or events such as hail.
The most valuable record here is a comparable image with a known serial number and capture date. A crack seen at delivery cannot be said to have occurred in transport just by looking at the image. Evaluating it alongside pre-shipment records makes it easier to trace the stage at which the damage appeared. How these records are presented to the supplier is covered in solar panel warranty claims.
What should a good EL test report include?
A useful report should explain, alongside the marked images, the conditions under which each finding was obtained. That way different teams can re-examine the same panel and compare it with the earlier evaluation.
At a minimum, look for the following in the report:
- Module serial number, model and test date.
- Applied current, measurement conditions and image quality information.
- The original image and the marked defect locations.
- Defect class, the reasoning behind the evaluation, and uncertain findings.
- The acceptance criterion used and, where needed, a recommendation for further tests.
For capturing, processing and interpreting EL images, IEC TS 60904-13:2018 is the directly relevant technical reference. Defining the imaging method and making a purchase acceptance decision are separate matters. The project criteria behind a pass/fail result in the report should be stated clearly.
AI-assisted EL image analysis
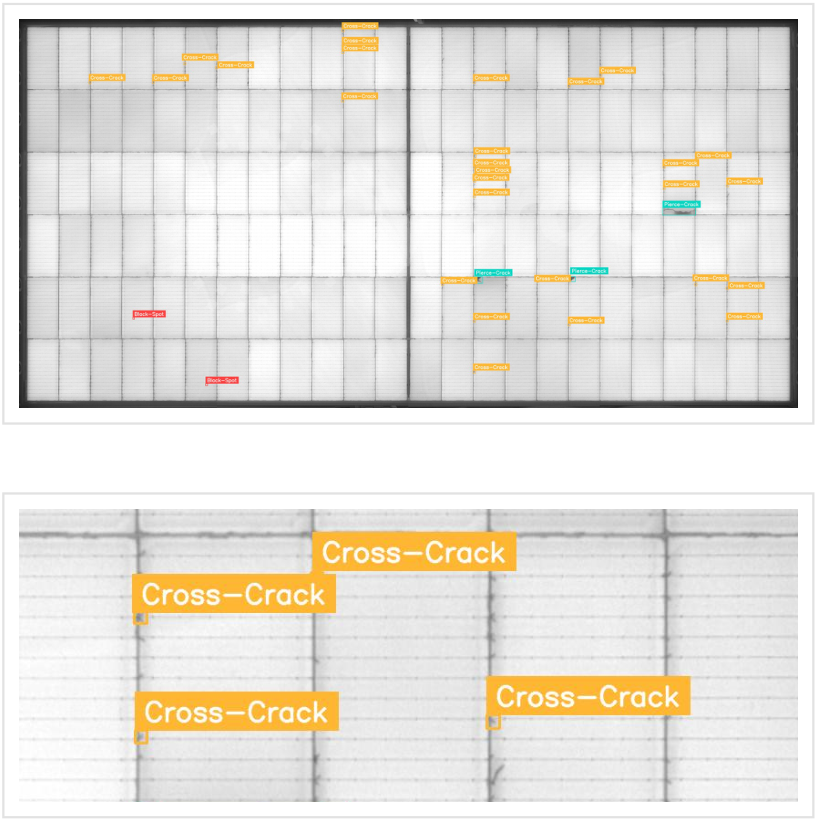
Evaluating the images of thousands of panels one by one requires consistent classification and record management. AI-assisted analysis can help flag suspicious areas, classify defects and set review priorities.
How reliable the result is depends on image quality, cell technology and whether the model has been validated on similar images. Flagging a defect and accepting or rejecting the panel are not the same step; the decision should be tied to defined criteria.
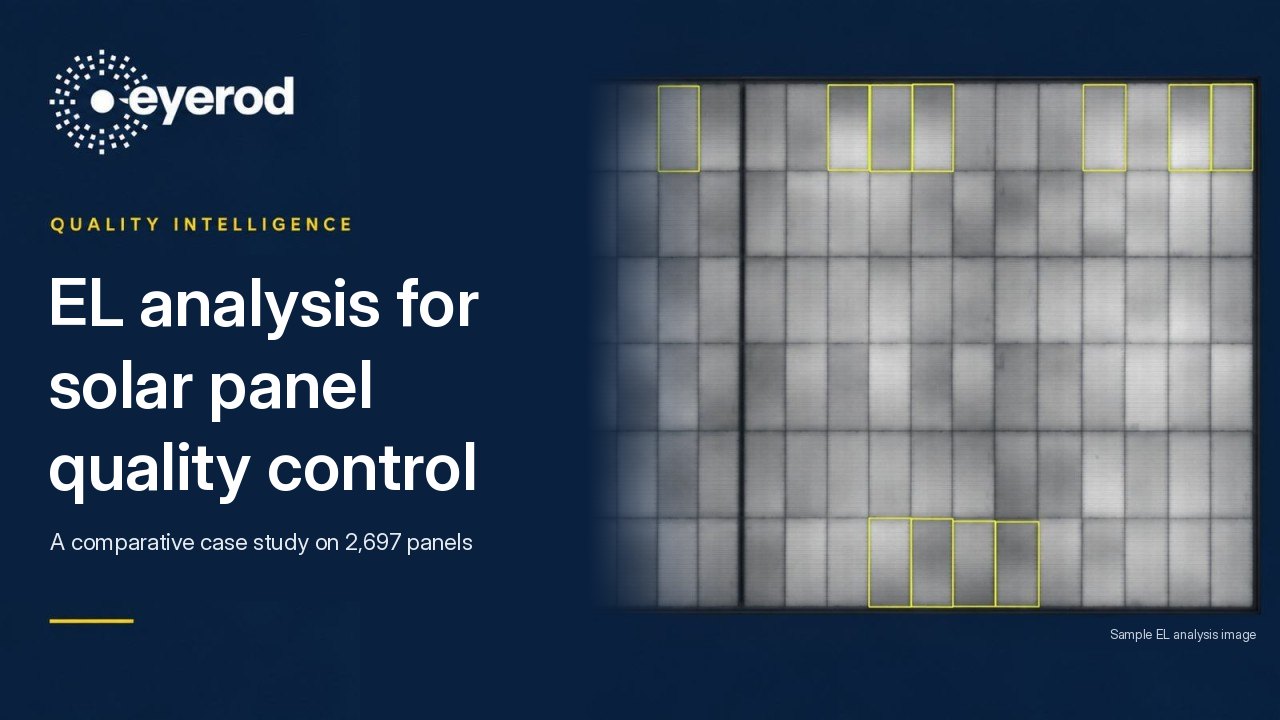
eyerod Quality Intelligence analyzes EL images from the factory with AI, classifies defects module by module and supports reporting against acceptance criteria. The service covers the analysis of existing EL images. This gives quality teams findings from their image archive that they can review and act on. We shared how this approach worked on 2,697 panels in our EL analysis case study.
Make defects in your EL images visible module by module
Getting value from EL inspection means matching images to the right module, classifying findings consistently and evaluating them together with the acceptance criteria.
To have the EL images from your factory or supplier analyzed module by module and to review your project’s quality control process, get in touch with the eyerod team.
EL Analysis for Solar Panel Quality Control: A 2,697-Panel Case Study