EL Image Analysis in PV Module Quality Control: Defect Detection and Acceptance Criteria
Quality Controleyerod · · 4 min read
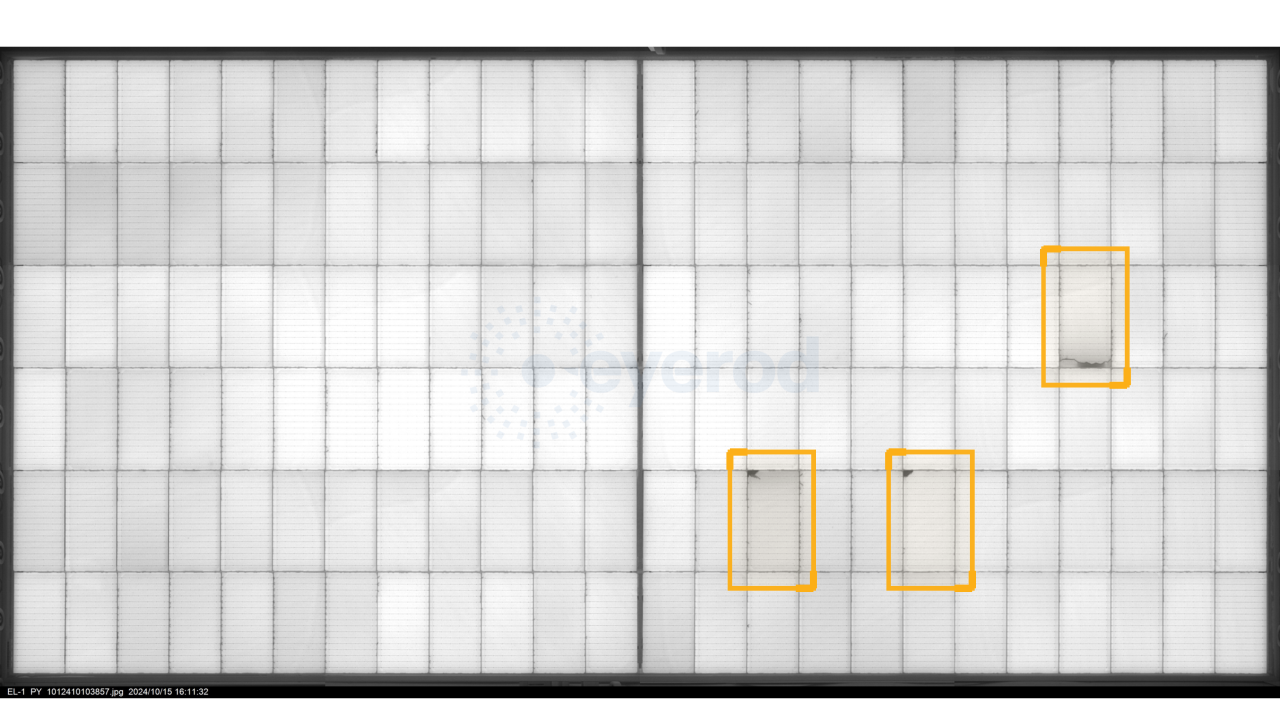
A PV module that looks intact from the outside is not necessarily flawless in its cell and interconnection structure. Microcracks, electrically isolated cell regions, finger and busbar interruptions, soldering issues, and inactive areas can all be invisible to the naked eye.
An EL image shows a defect. It does not decide "accepted" on its own.
Electroluminescence imaging makes these regions visible. When reverse current is applied to a module in a dark environment, the cells emit near-infrared light. Electrically active regions and regions where the current is interrupted or weakened appear at different intensities in the image.
This is why an EL image is a powerful data source for teams assessing module quality. But finding a trace in an image and rejecting the module are not the same decision.
The IEC standard describes the method
IEC TS 60904-13 defines the method for how EL images of PV modules should be captured, processed, and interpreted. It provides a common framework for classifying cracks in an image and measuring inactive areas.
However, the standard does not set a single commercial acceptance or rejection threshold valid for every project. Which finding is considered acceptable, borderline, or rejectable must be defined together with the module technology, the procurement specification, the contract terms, and the project's risk approach.
This approach is deliberate. The same image finding can be assessed differently depending on module technology, cell interconnection, the location of the defect, its electrical impact, and the buyer's risk approach. So while the technical standard aligns the measurement language, the commercial decision is set by the specification and contract between buyer, manufacturer, and EPC.
The electrical impact of a crack matters as much as its presence
In EL assessments, cracks are generally handled through three basic behaviors:
- Linear cracks that do not create an electrically inactive area
- Cracks that partially disconnect part of a cell from the circuit
- Cracks that largely isolate part of a cell electrically
This distinction is more functional than the question "is there a crack?". Procurement and quality teams do not just need to see the defect; they need to consistently determine which acceptance class the finding falls into.
Two concepts should not be confused here. The crack modes in the EL literature are not the same system as the A, B, or C quality grades used in the market. One expresses the electrical behavior of a specific crack; the other expresses the overall commercial quality grade of the module.
Acceptance criteria should be written at the procurement stage
For EL images to genuinely contribute to the procurement decision, acceptance criteria must be defined while the contract is being prepared, not after the review has started.
In a solid framework, the answers to these questions are known in advance:
- Which defect classes will be considered critical, major, or minor?
- Which findings per cell or per module will not be accepted?
- How will borderline images be handled?
When these definitions are missing, EL analysis produces many images and defect labels, but the commercial decision remains open to interpretation. When they are defined, the same data becomes a traceable record in manufacturer negotiations, batch acceptance, and the warranty file.
AI builds a shared assessment language across thousands of images
On a large-scale project, reviewing EL images purely manually becomes difficult in terms of time, consistency, and reporting. AI-assisted analysis can scan images with the same classification logic and surface defect candidates and the relevant modules.
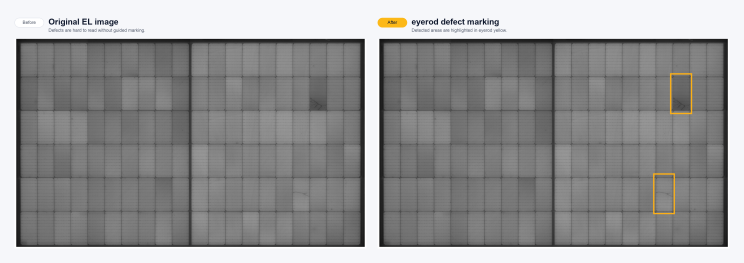
Still, model accuracy is not a fixed number. The camera system, image quality, module technology, cell structure, and training data all affect the results. So AI output should be used together with the project-specific acceptance criteria and a defined assessment process for borderline cases.
Where does eyerod Quality Intelligence fit in this flow?
eyerod analyzes EL images captured at the factory with its Quality Intelligence product. It detects and classifies defects in the images and organizes the results per module into an output that can be used in the acceptance and rejection process.
This way, the EL archive is not just a set of image folders. Which finding is on which module, which class the finding falls into, and how it was handled in the decision process are kept in a shared data structure.
Quality Intelligence is the first layer of eyerod's Solar Intelligence structure, which extends from quality control to construction and operations across solar projects. Construction Intelligence covers site progress, and Asset Intelligence completes the Thermal Analysis and Digital Twin process within the same project-management approach.
Conclusion
An EL image reveals quality findings that cannot be seen with the eye. A reliable acceptance process, however, is built when the standard method, criteria defined in the contract, a correct sampling plan, and consistent image analysis work together.
To turn the EL images in your module procurement process into a more organized and traceable decision flow, you can get in touch with the eyerod Quality Intelligence team.
References
- IEC TS 60904-13: Photovoltaic devices – Electroluminescence of photovoltaic modules
- IEA PVPS Task 13: Review of Failures of Photovoltaic Modules
- ISO 2859-1: Sampling procedures for inspection by attributes
- Deitsch et al.: Automatic classification of defective photovoltaic module cells in electroluminescence images
Solar As-Built: Design-to-Site Comparison with Drone Data