Customer Success Story
EL Analysis for Solar Panel Quality Control: A 2,697-Panel Case Study
eyerod · · 7 min read
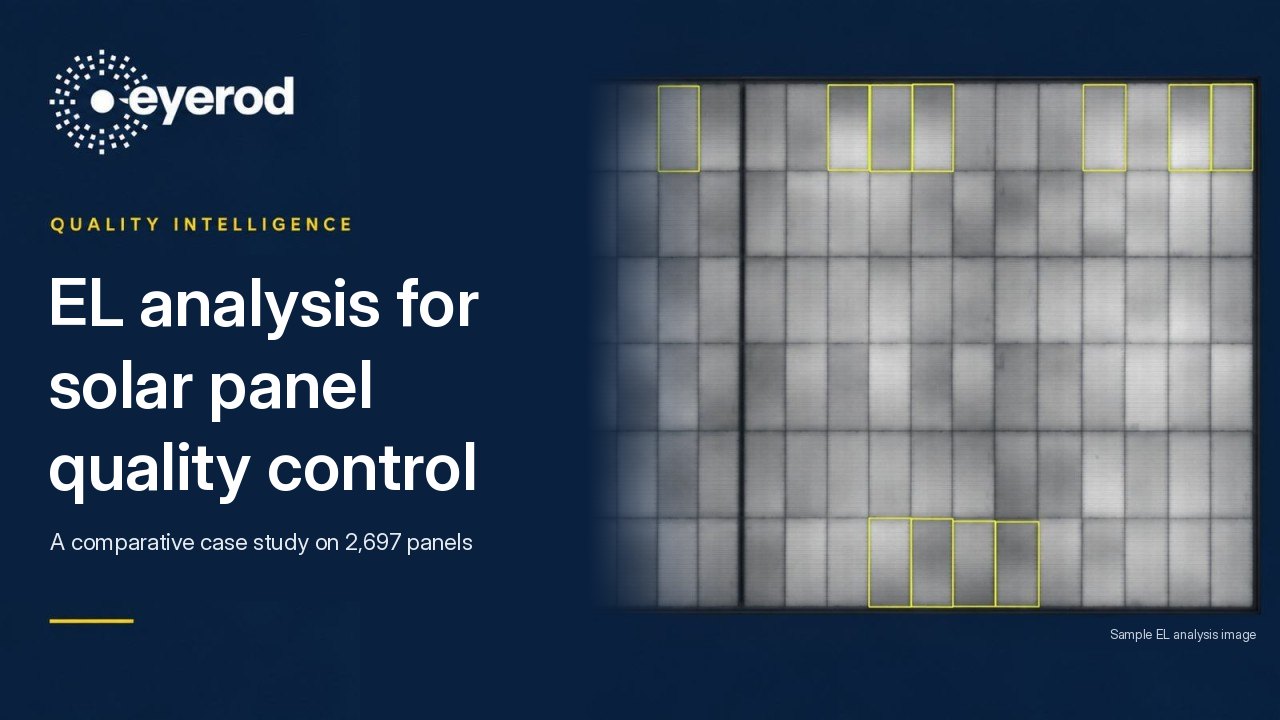
AI-assisted EL analysis on 2,697 panels with eyerod Quality Intelligence
Solar panel quality control starts before the panels leave the factory. In this project, eyerod analyzed the EL images taken at the factory with our Quality Intelligence solution. Across 2,697 panels, we compared our analysis with the experts’ review of the same EL images and examined the differences in detection and evaluation panel by panel.
An energy company wanted to make the acceptance inspection of the photovoltaic panels supplied for its solar projects more consistent and measurable. A defective panel reaching the site means more than a product replacement: it brings warranty disputes, extra logistics, field intervention and long-term production risk.
We evaluated the images from the factory electroluminescence test in two stages. First, our AI model detected the defects. Then we filtered these findings against the quality criteria in the supply contract’s annex to produce our final report. Our report included 218 panels that were missing from the report prepared by experts reviewing the same EL images by eye.
What is EL analysis and why does it matter for solar panel quality control?
An electroluminescence test images defects in solar panel cells that are hard to see with the naked eye. EL analysis is the review of these images for cell cracks, interruptions in the thin conductive lines on the cell (fingers), color differences and manufacturing anomalies.
Capturing the image is not enough to detect solar panel defects. To support an acceptance decision, the findings have to be evaluated against consistent criteria. For large batches, the core question is:
THE CORE QUESTION: How can thousands of images be evaluated with the same criteria and the same sensitivity in every batch?
The human inspection we compared against in this case was the experts’ visual review of the EL images taken at the factory. This method requires expertise, but as the number of images grows, attention fatigue and differences in interpretation between reviewers can affect the evaluation.
In this project, the quality criteria in the contract annex did not state measurable tolerances such as area, length or color intensity clearly enough for some defect classes. So besides detecting the findings, we also had to make visible which evaluation thresholds we used to include them in the report.
EL image analysis with eyerod Quality Intelligence
We processed the EL images taken at the factory in batches with our Quality Intelligence solution. In the photovoltaic panel quality control process, we ran detecting the findings and evaluating them against the contract criteria as separate steps.
In the first step, our AI model scanned every image and produced a confidence score for each finding it detected. In the second step, we evaluated the size, darkness and area of the findings. The thresholds we applied in line with the quality criteria in the contract annex determined which findings went into the final report.
We gave the project team a labeled report showing the defect class, its location on the panel and the reason for the evaluation. We shared the results of the batches processed with Quality Intelligence within 24 hours at most.
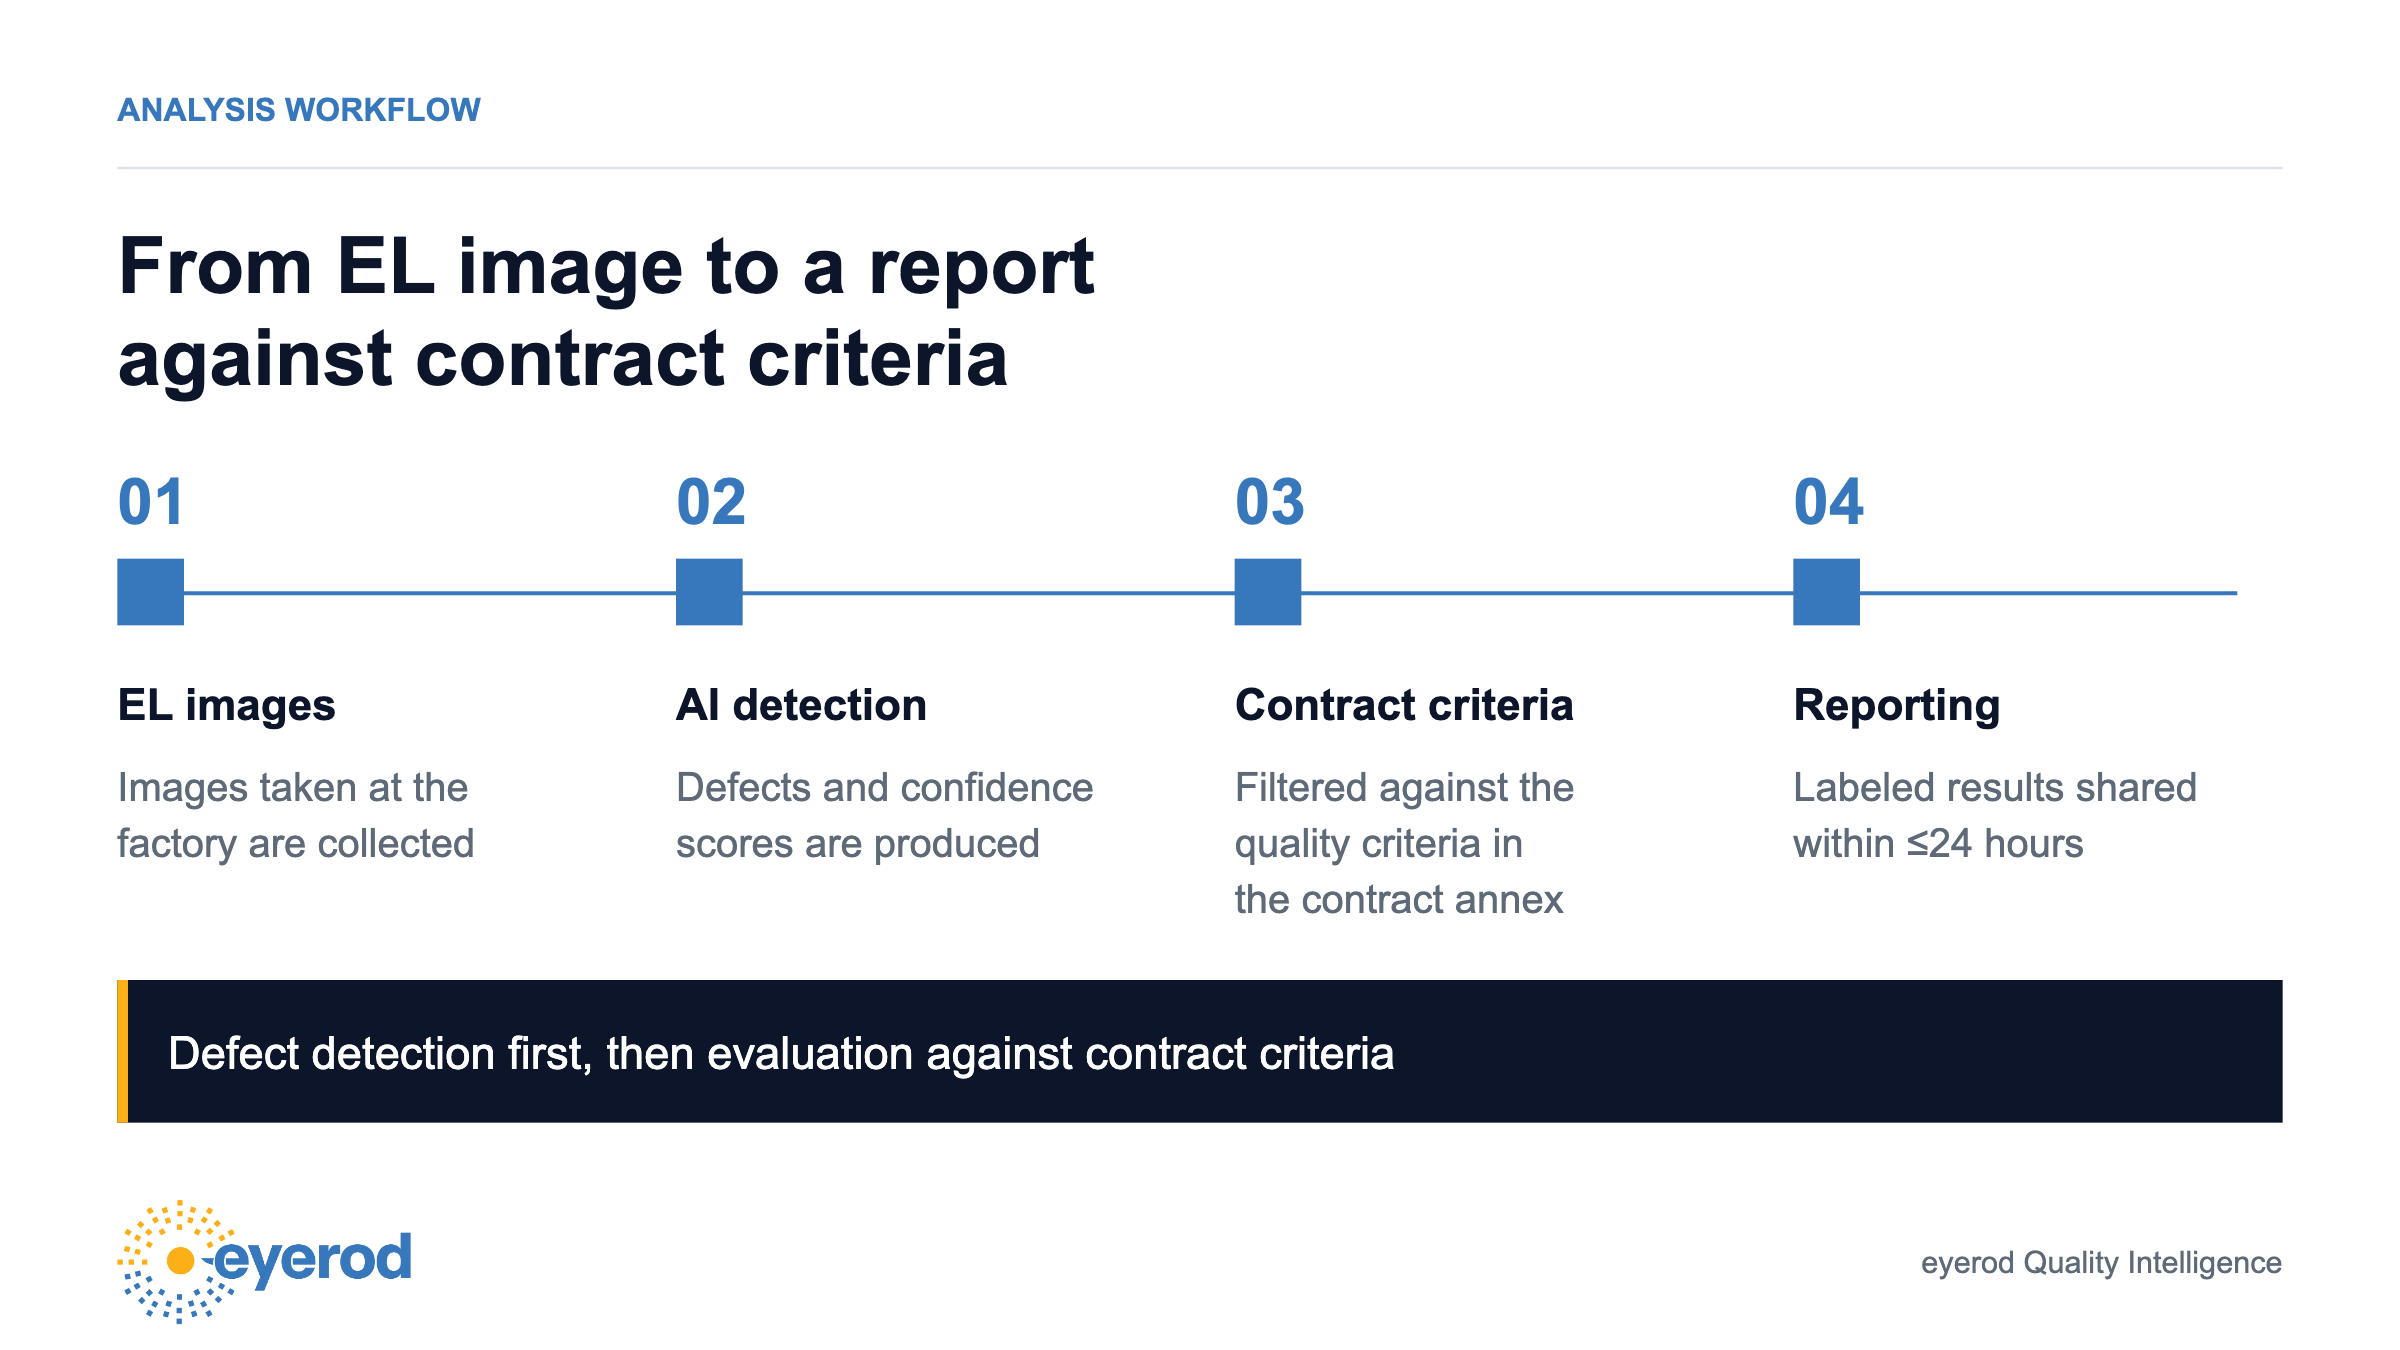
In this workflow, when we reprocessed the same image with the same model version and the same evaluation thresholds, we got the same result. This let us apply the same analysis steps to every panel and show which criteria each reporting decision rested on.
Expert review vs. AI in solar panel defect detection
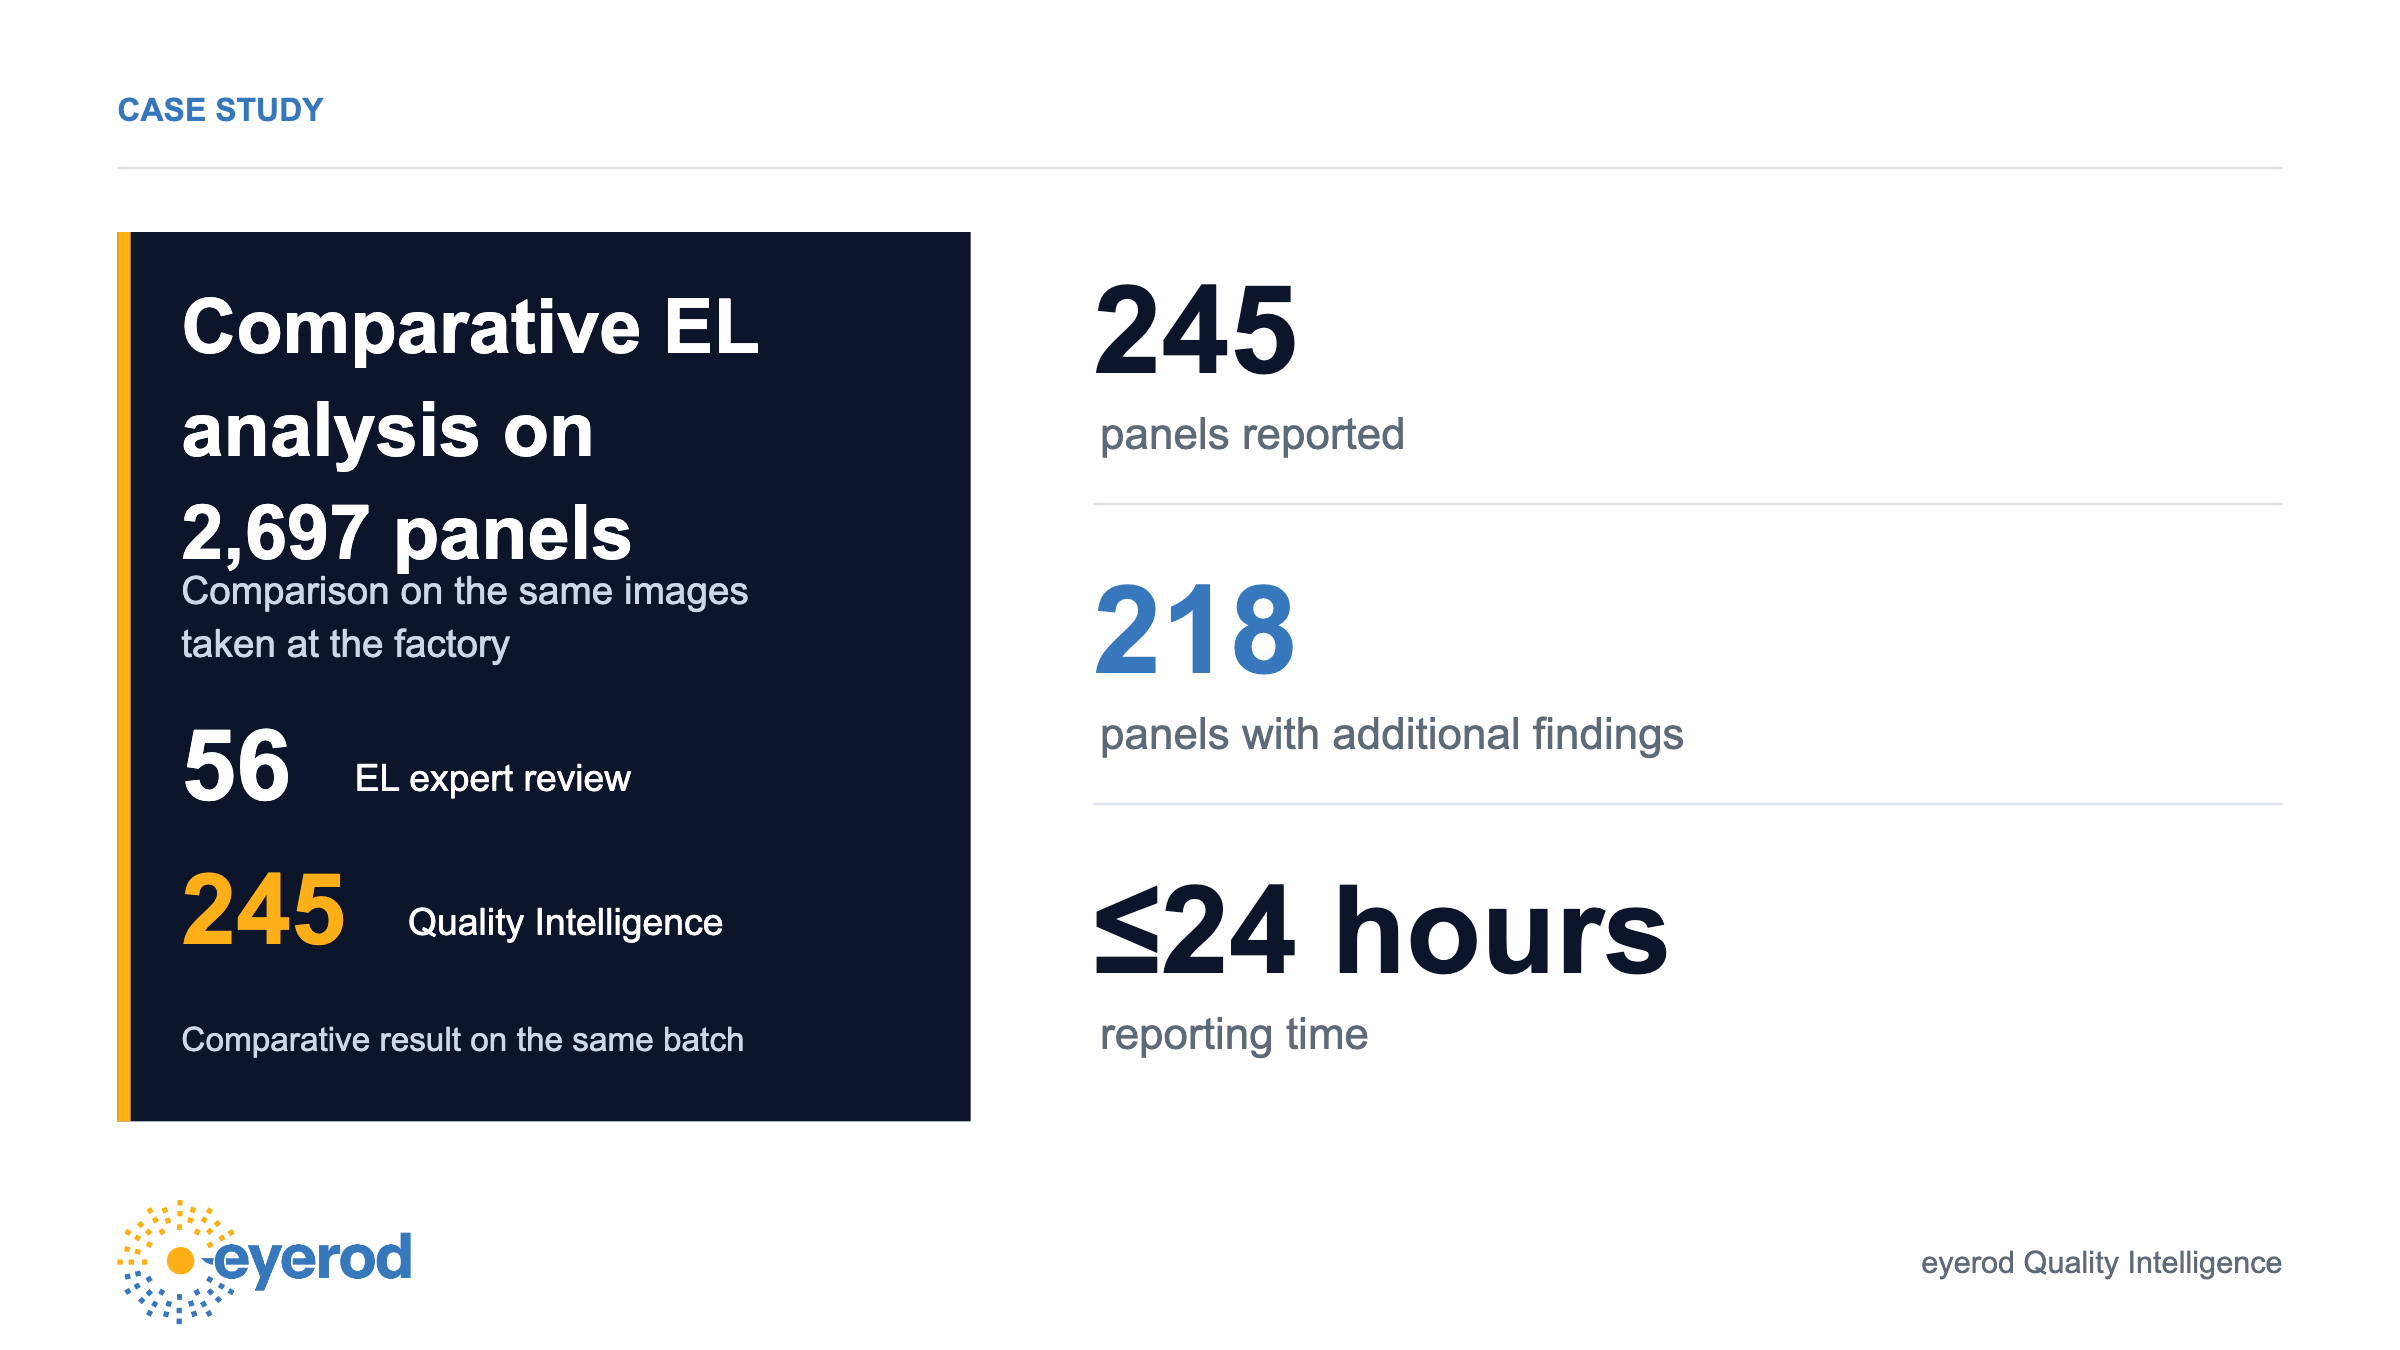
On the EL images of the same 2,697-panel batch, the experts’ report listed 56 panels, while our final report from Quality Intelligence listed 245. Within the whole batch, these came to 2.1% and 9.1% respectively.
We compared the two reports panel by panel. 27 panels appeared in both. 218 panels in our report did not appear in the experts’ report.
The findings in these 218 panels broke down as follows:
- Cracks in 101 panels
- Finger (conductive line) defects in 92 panels
- Scratches in 25 panels
Among the crack findings, 47 panels had ribbon-cutting or cross cracks, which the quality booklet in the contract annex classifies as unacceptable.
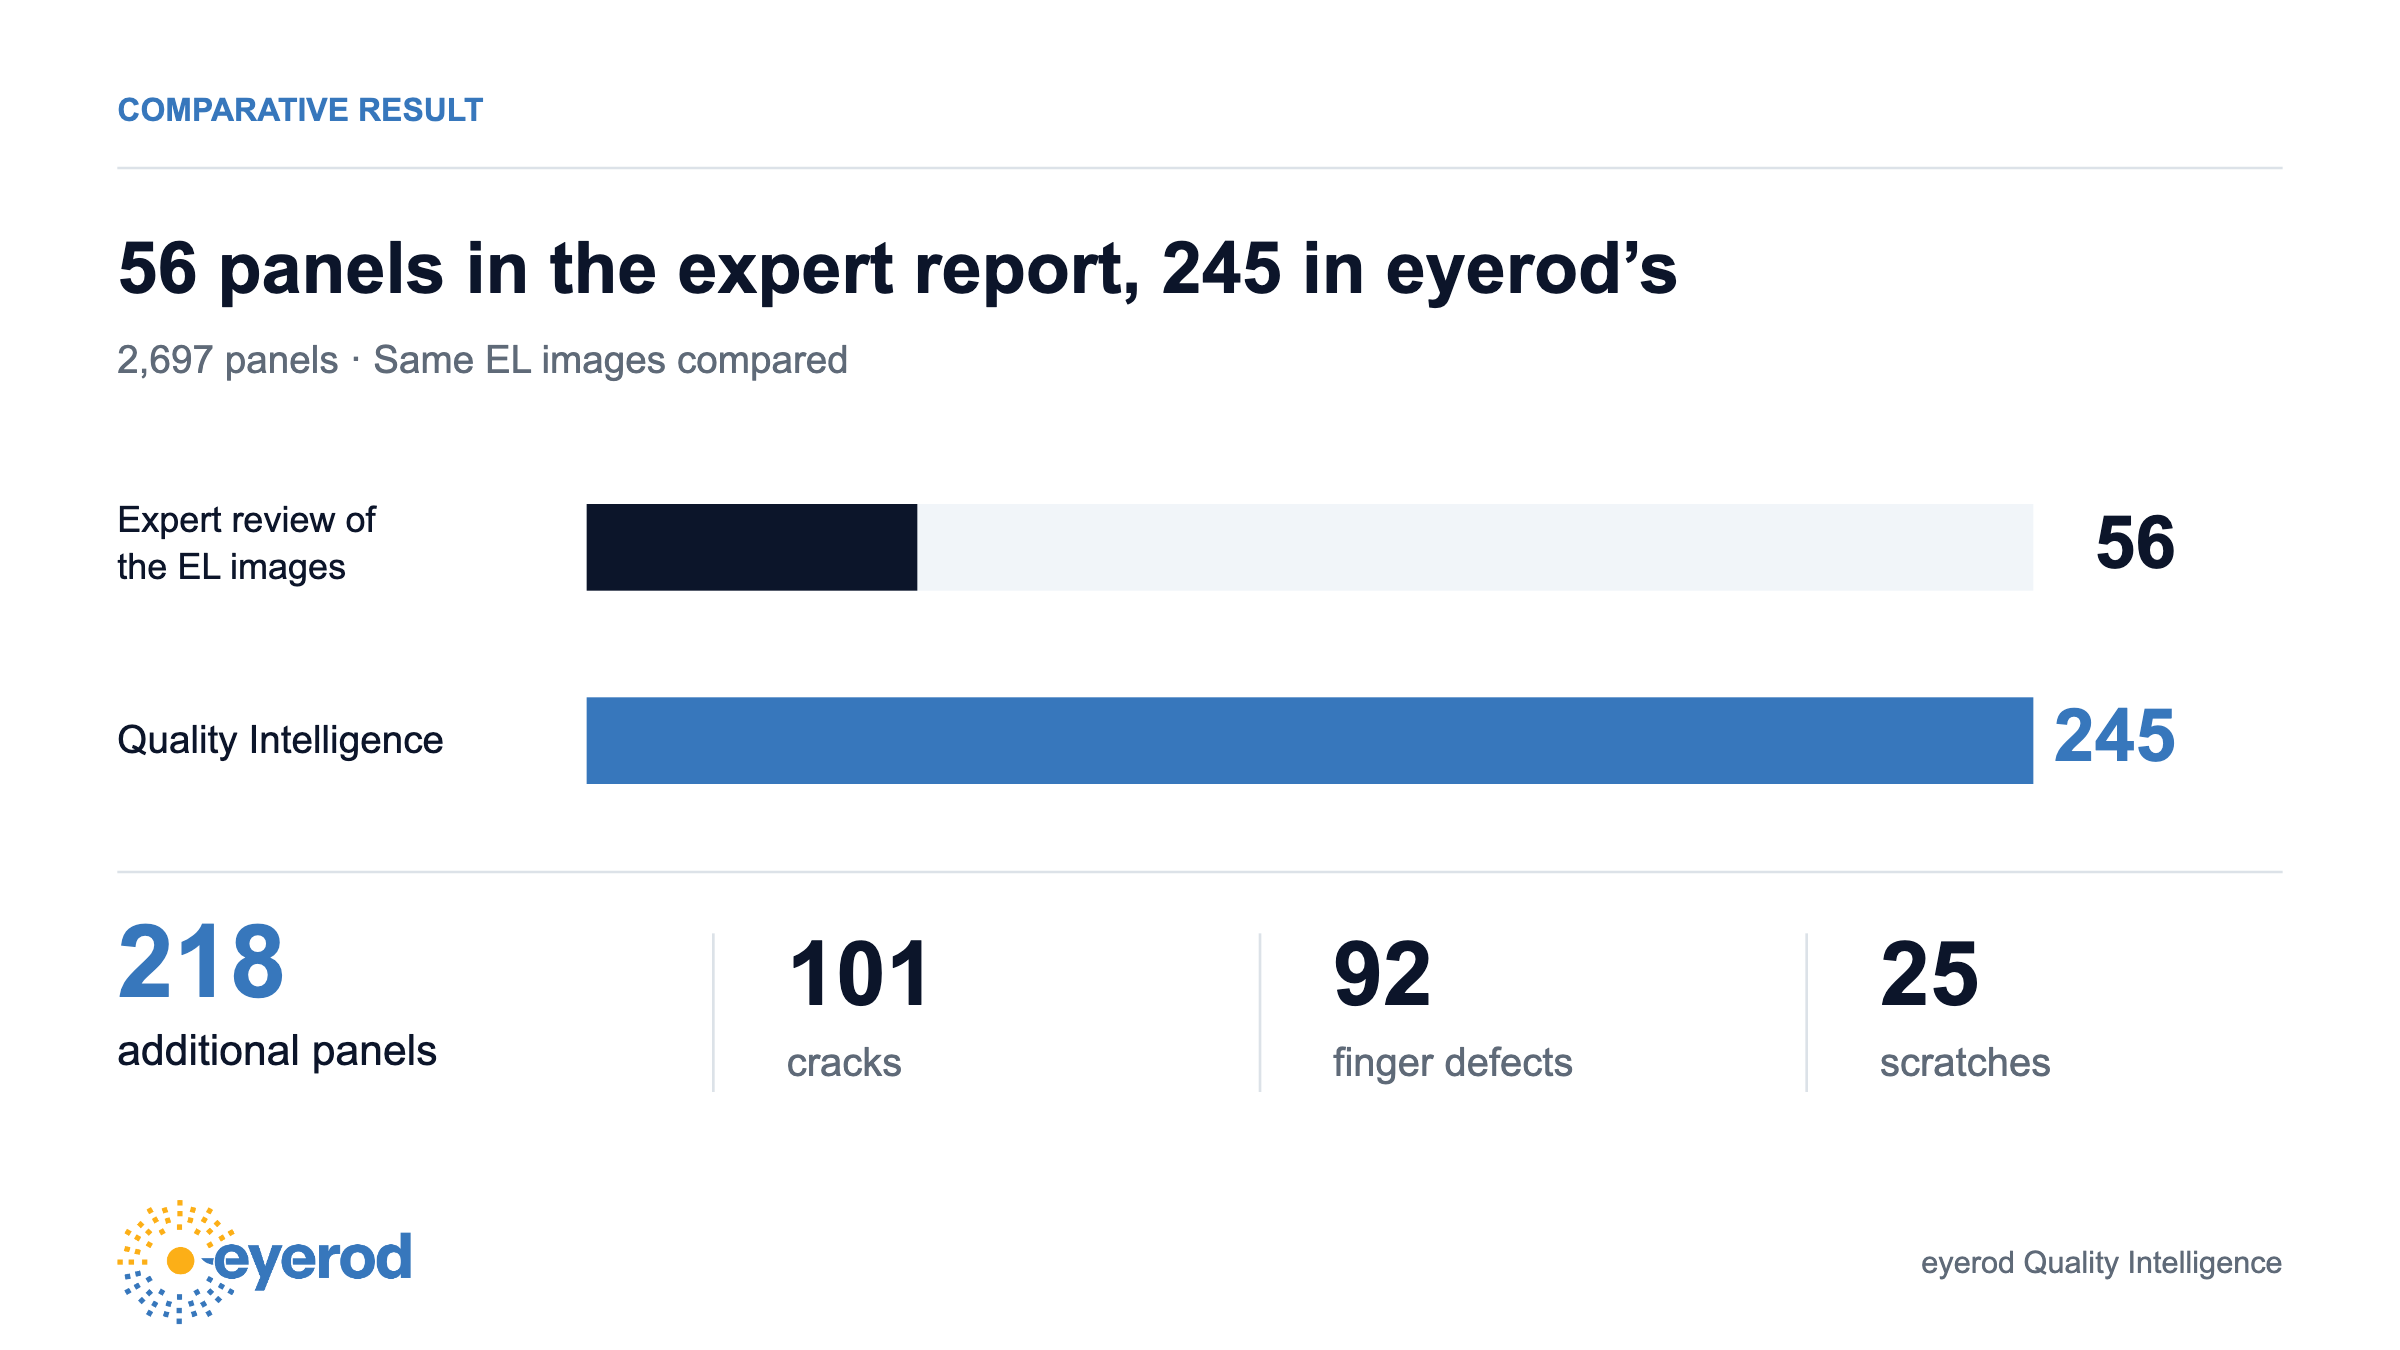
Beyond the totals, this comparison showed the type of the additional findings and how much they mattered under the acceptance criteria. Finding unacceptable cracks in 47 panels missing from the expert report was one concrete, panel-level example of the difference.
Detection vs. evaluation against acceptance criteria in EL image analysis
Our model detecting a finding does not automatically make that panel a reject. We first identified the finding in the image, then evaluated whether it belonged in the report in line with the quality criteria in the contract annex and the thresholds applied.
We re-examined the 29 panels that were in the experts’ report but not in our final report:
- The findings in 2 panels were not defects under the defined quality criteria.
- Our model had detected the findings in 22 panels, but they fell below the severity threshold applied and so were left out of the final report.
- Our model had not detected the findings in 5 panels.
This re-examination let us separate the panels where the difference between the reports came from the evaluation criteria from those where it came from a missed detection. That way we could show the project team the scope and limits of the results clearly.
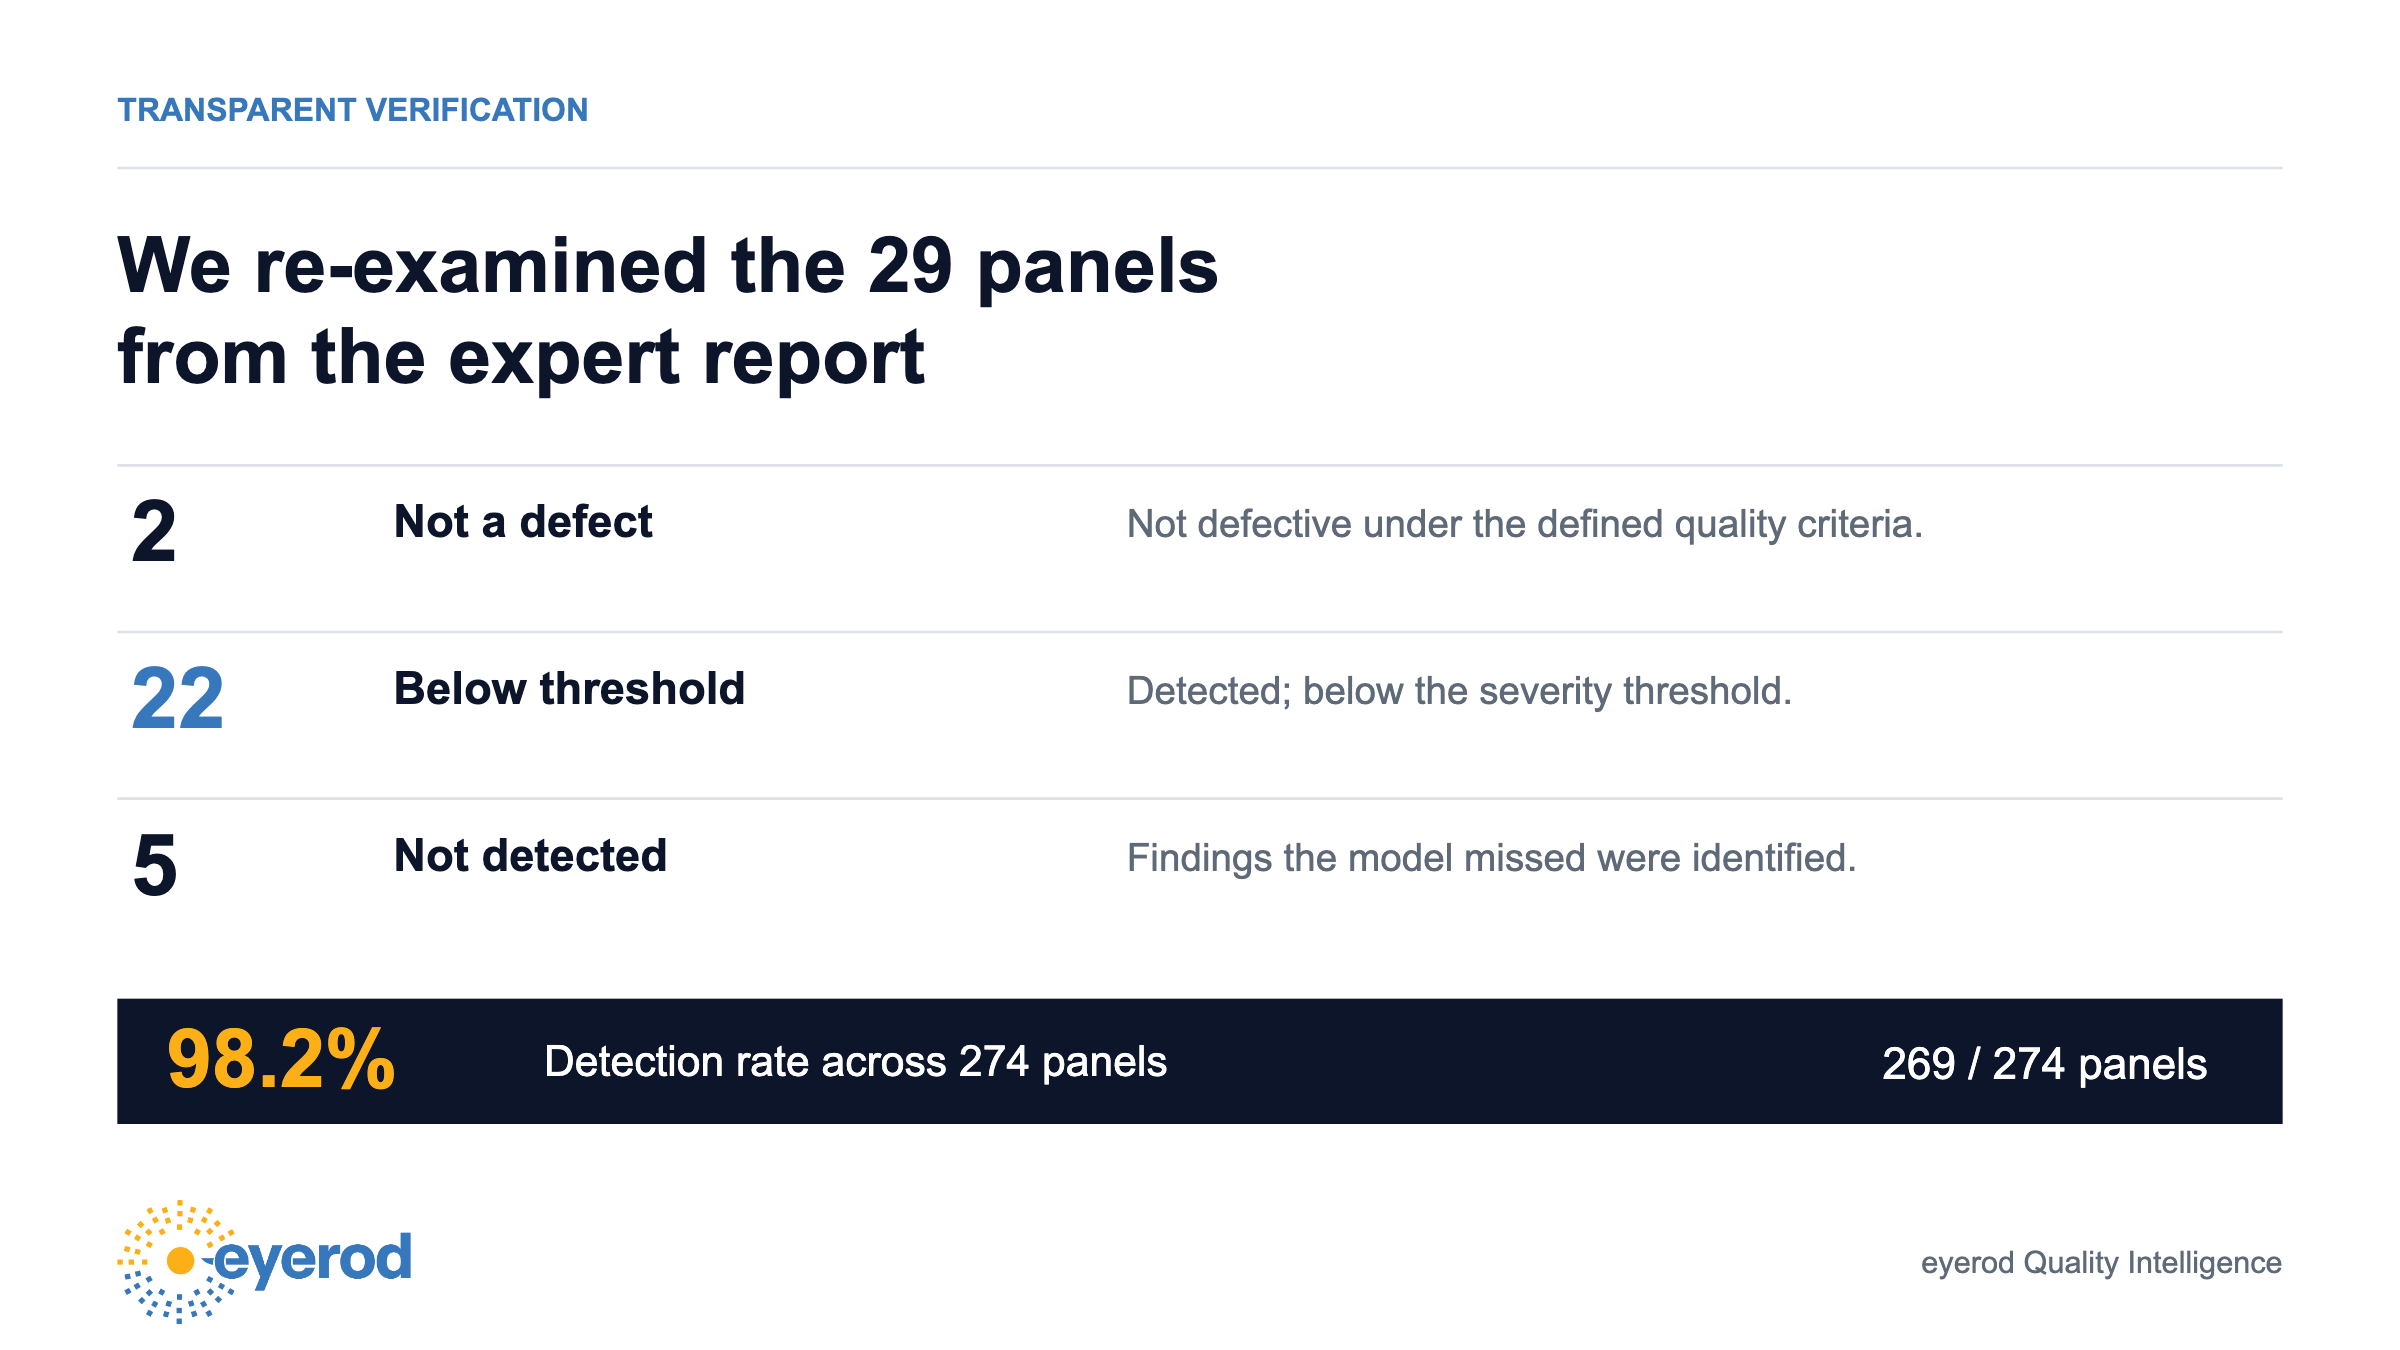
Combining the panels in both reports and counting the shared ones once gave us 274 panels. Our model detected findings in 269 of them and missed 5. The 98.2% figure is the detection rate within these 274 panels. 245 of them passed the evaluation thresholds and went into our final report. So 98.2% is not an accuracy rate or a reject rate for all 2,697 panels.
How we showed the difference from human inspection in EL analysis
In this case, we assessed what our Quality Intelligence solution contributed by comparing results on the same EL images of the same batch. Against 56 panels in the expert report, our final report listed 245. We examined the defect breakdown of the 218 panels found only in our report; 47 of them had cracks that were unacceptable under the contract criteria.
We also checked the difference in the other direction. Re-examining the 29 panels that were in the expert report but not in ours, we found that in 22 panels the finding was detected but fell below the threshold, 2 panels were not defective under the criteria, and 5 panels were missed by our model.
In human review, the evaluation depends on the expert’s attention and interpretation; with Quality Intelligence, we applied the same detection and filtering steps to every image. We showed the difference in this case through panel-level findings; we did not separately measure how much of it came from attention fatigue or differences in interpretation.
In the end, with eyerod Quality Intelligence we made visible the findings that did not make it into the expert report during factory acceptance inspection, and explained with concrete examples why the two reports diverged. This gave the project team a more comprehensive technical review to act on before shipment.
We covered how defective panels are documented to the supplier in solar panel warranty claims, and how the same approach worked on an EPC project in the Enexus case study. What an EL image does not measure is discussed in Does an EL image measure a panel’s annual power loss?
To evaluate EL images panel by panel and against the same criteria in your module supply process, get in touch with the eyerod Quality Intelligence team.
Frequently asked questions
What is EL analysis?
EL analysis is the review of panel images taken with an electroluminescence test for cell cracks, finger (conductive line) interruptions, color differences and manufacturing anomalies. To support an acceptance decision, the findings have to be evaluated consistently against the quality criteria in the contract.
How many more panels did AI-assisted EL analysis report than the expert review?
On the EL images of the same 2,697 panels, the expert report listed 56 panels and the eyerod Quality Intelligence final report 245. 218 panels were only in the eyerod report; 101 of them had cracks, 92 finger defects and 25 scratches, and 47 panels had cracks that were unacceptable under the contract criteria.
What does the 98.2% detection rate mean?
It is the detection rate within the 274 panels that make up the union of both reports: the model detected findings in 269 panels and missed 5. It is not an accuracy rate or a reject rate for all 2,697 panels.
Is every panel where the model detects a finding a reject?
No. The finding in the image is detected first, then evaluated against the quality criteria and severity thresholds in the contract annex to decide whether it goes into the report. In this case, findings were detected in 22 panels from the expert report but fell below the threshold and were not included in the final report.
Enexus: From Panel Quality Control to Daily Site Tracking