Tracking progress on a utility-scale solar construction site requires more than a collection of site photos. For project teams, the useful question is whether the physical work on site can be compared with the project plan using the same locations, work items and reporting dates. Regular drone data collection can support that process when it is combined with orthophotos, component counts and period-to-period comparison.
From site imagery to measurable progress
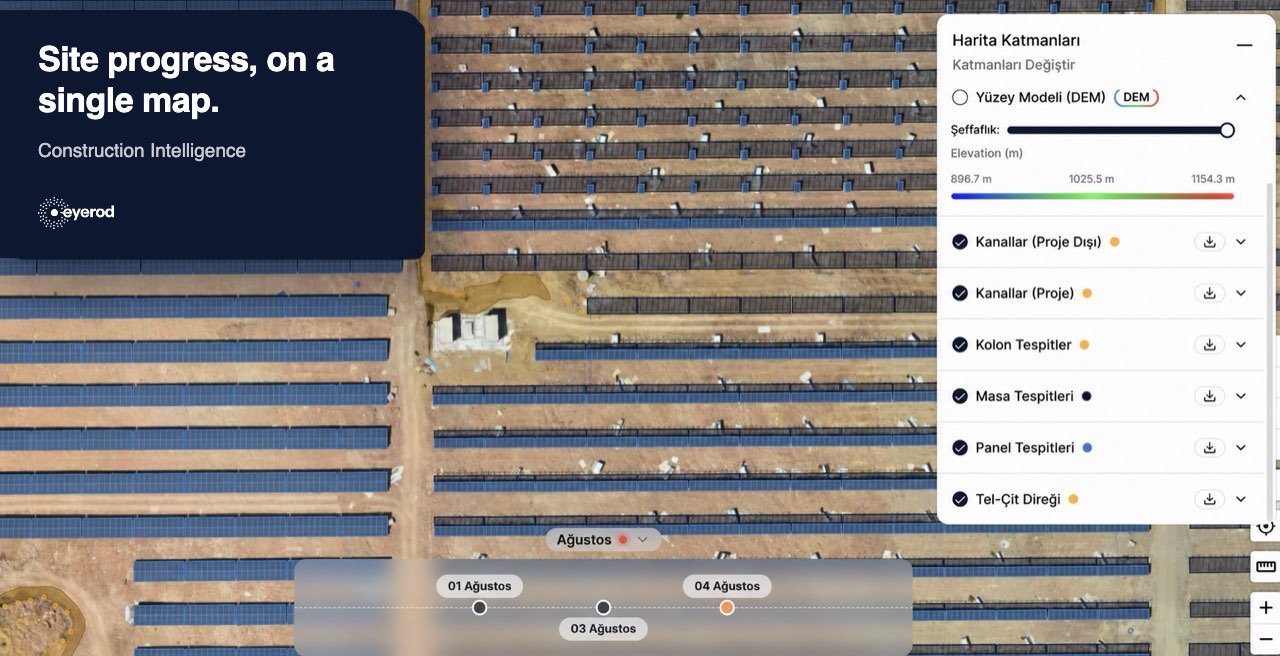
A consistent workflow starts with repeatable flights. Similar flight corridors, altitude, image overlap and capture conditions make it easier to compare one survey with the next. RGB imagery can be processed into an orthophoto: a geometrically corrected, top-down view of the site. A digital surface model adds another layer for reviewing earthworks, excavation or changes in site topography.
The next step is to connect what is visible in the imagery to the project’s work items. Piles, structures, modules, roads, excavations and fencing can be reviewed by block, area or construction stage. This requires clear definitions. A driven pile, an installed table structure and a mounted module are different stages of progress and should not be collapsed into one headline percentage.
What can be tracked?
Drone-based progress tracking is especially useful for activities that are distributed across a large site and visible from above. Typical examples include excavation routes and backfilling, access roads, grading, piles, structures, module installation, inverter stations, fencing and block-level completion. Not every item is measured with the same method or confidence level. Volume assessments from a surface model and module counts from RGB imagery should therefore be reported as separate outputs.
An effective progress report is a decision document, not a photo album. It should state the flight and report date, show the orthophoto, provide block-level quantities, compare the current period with the previous one, and highlight open items. Areas not covered by the flight or not suitable for measurement should also be visible. This makes the limits of the data clear to every project stakeholder.
eyerod Construction Intelligence
eyerod Construction Intelligence connects drone RGB imagery to a site-management workflow within a project-management platform. Regular flights support orthophoto and digital surface model creation, while mechanical components, excavations, fencing and related site elements can be recorded against the current site condition. Detailed reports, map-based cross-sections, excavation tracking, punch lists and ITP records can be connected to the relevant location or asset.
The result is a shared project record that allows site and office teams to work from the same date, map and quantity view. Learn more about eyerod Solutions.
Practical questions
Can drone data support payment applications? It can provide useful quantity and location evidence. The contract’s accepted measurement method and approval process remain decisive.
Is GSD the same as positional accuracy? No. GSD describes the approximate ground size represented by one pixel. Positional accuracy also depends on RTK/PPK, ground control, calibration and processing quality.
How often should flights take place? There is no universal interval. The frequency should match construction intensity, reporting cadence and the decisions the team needs to make.
To see how location-based field records continue to matter after construction, read Why Solar Monitoring Data Isn’t Enough.
For comparing the same capture against design files and recording the built condition, see solar as-built and design-to-site comparison; for managing what is still open at handover, see punch lists and ITPs.
Drone Dock Systems in Solar Site Monitoring: Automated Flights, Mapping, and Progress Reporting